Wednesday, August 13, 2014

It's Going to be a Busy Fall

Here are some of the professional engagements I have between now and the end of the year:
  • October 4 & 5 - GAFE Summit Coronado
    • I have applied to present about Add-ons for Google Docs and Sheets, specifically Flubaroo, Doctopus, and g(Math). I expect to hear whether or not I have been accepted in early September. Either way, I hope to get a team from our district to attend.
  • October 18 - EdCamp San Diego
    • I'm one of the organizers for this event. Last year was our first, so since we (presumably) know what we're doing this year, I think the planning will not be nearly as arduous as it was last year.
  • October 24 & 25 - Fall CUE, American Canyon HS
    • I will be presenting about Blackboard Summer Academy, but broadening it to the use of any LMS, so I've re-titled my talk "[Insert LMS Here] Summer Academy". It will be very similar to the talk I gave at the Blackboard workshop in Chula Vista last year.
  • November 15 - SDCUE Tech Fair, La Costa Canyon HS
    • I will be presenting (again, hopefully) about Add-ons for Google Docs and Sheets. And, since it was my suggestion to bring the SDCUE Tech Fair to LCC in the first place, I will also be working closely with SDCUE as a liaison for the district.
  • December 12 & 13 - eSS Symposium, San Mateo
    • Here I will be reprising my [Insert LMS Here] Summer Academy talk.
Whew!

Saturday, August 9, 2014

What I Did on My Summer Vacation

End of June - ISTE Annual Conference - Atlanta, Georgia
My first trip of the summer started about a week after I had finished the school year. For the third year in a row, I was able to attend the huge annual conference put on by the International Society for Technology in Education (ISTE). In 2012, the conference was in San Diego; in 2013, I traveled to San Antonio. This year I flew to Atlanta for this enormous ed-tech affair.

The size of this conference is both a blessing and a curse. Because of the number of attendees, ISTE can attract some of the best keynote speakers, the best presenters, and a vast array of vendors for the exhibit hall. On the other hand, nearly every major session is crowded, overflowing, or with a huge line to get in. I had more than one instance in which I went to attend a session, saw the line of people waiting to get in, and just turned around and walked away. The crowds got frustrating after a while.

The best formal session I attended was a talk by Dr. Ruben Puentadura, creator of the SAMR model for instructional technology integration. He gave a great description of the connections between the TPACK model and his SAMR model, showing the overlap and similarities. It really helped me with a better understand of TPACK. (I've written before about my preference for SAMR over TPACK when working with teachers.)
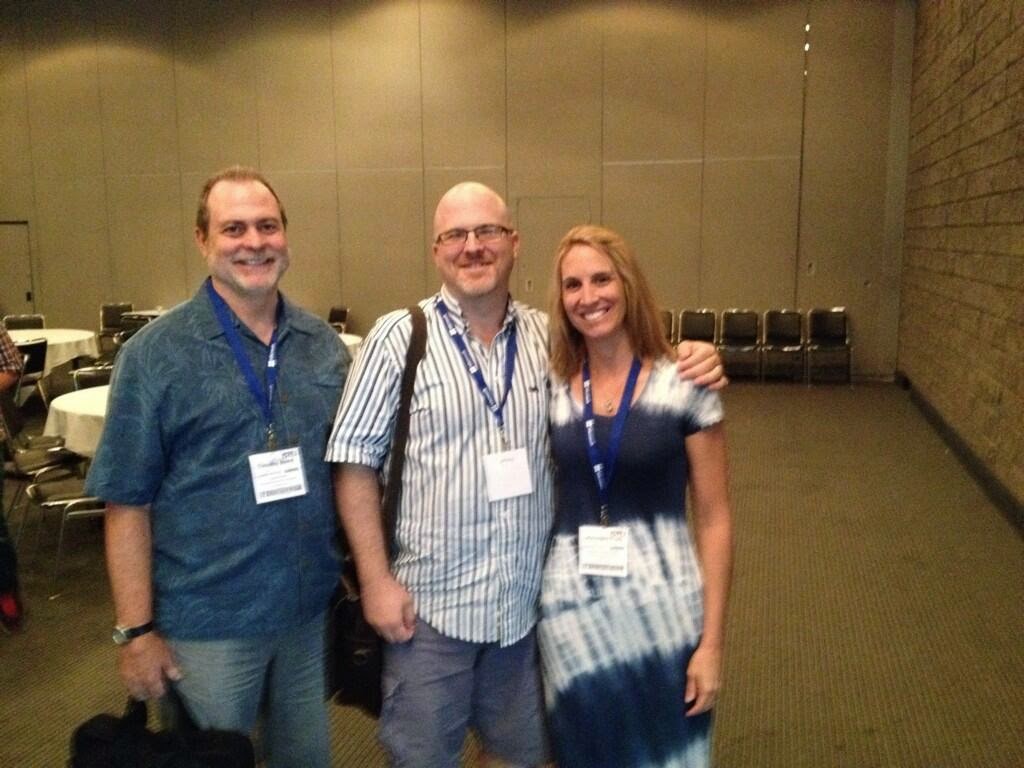
With Tim Baird and Leighangela Brady of Encinitas USD
The exhibit hall for ISTE is always massive; too much to take in for any one person. At other conferences, I set aside time to just wander up and down the aisles, seeing what companies are there and what they might be able to offer us. There is no way you could accomplish this at ISTE. What I did instead was go through the program and pick out eight or ten vendors I wanted to talk to, then targeted those booths. Even so, that ended up taking me the better part of an afternoon, and I was exhausted from walking back and forth across the cavernous exhibit hall.

Despite the size of the crowd, I did manage to meet up with people I knew, thanks to social media. The night I got in to Atlanta, I met up with a group of teachers, many from California, at a German-style beer garden for a "#brewCUE". I arranged to meet up with Dr. Brady and Tim Baird from Encinitas; we talked after a session on effective PD for teachers. Mike Guerena from Encinitas was on my flight from San Diego; I only found out after tweeting about the flight delays. I had lunch with Torrey Trust, my former student at La Costa Canyon and newly minted Ph.D. from UC Santa Barbara. Her talk on how teachers used social media was enlightening and exactly in line with other research presented at the conference.
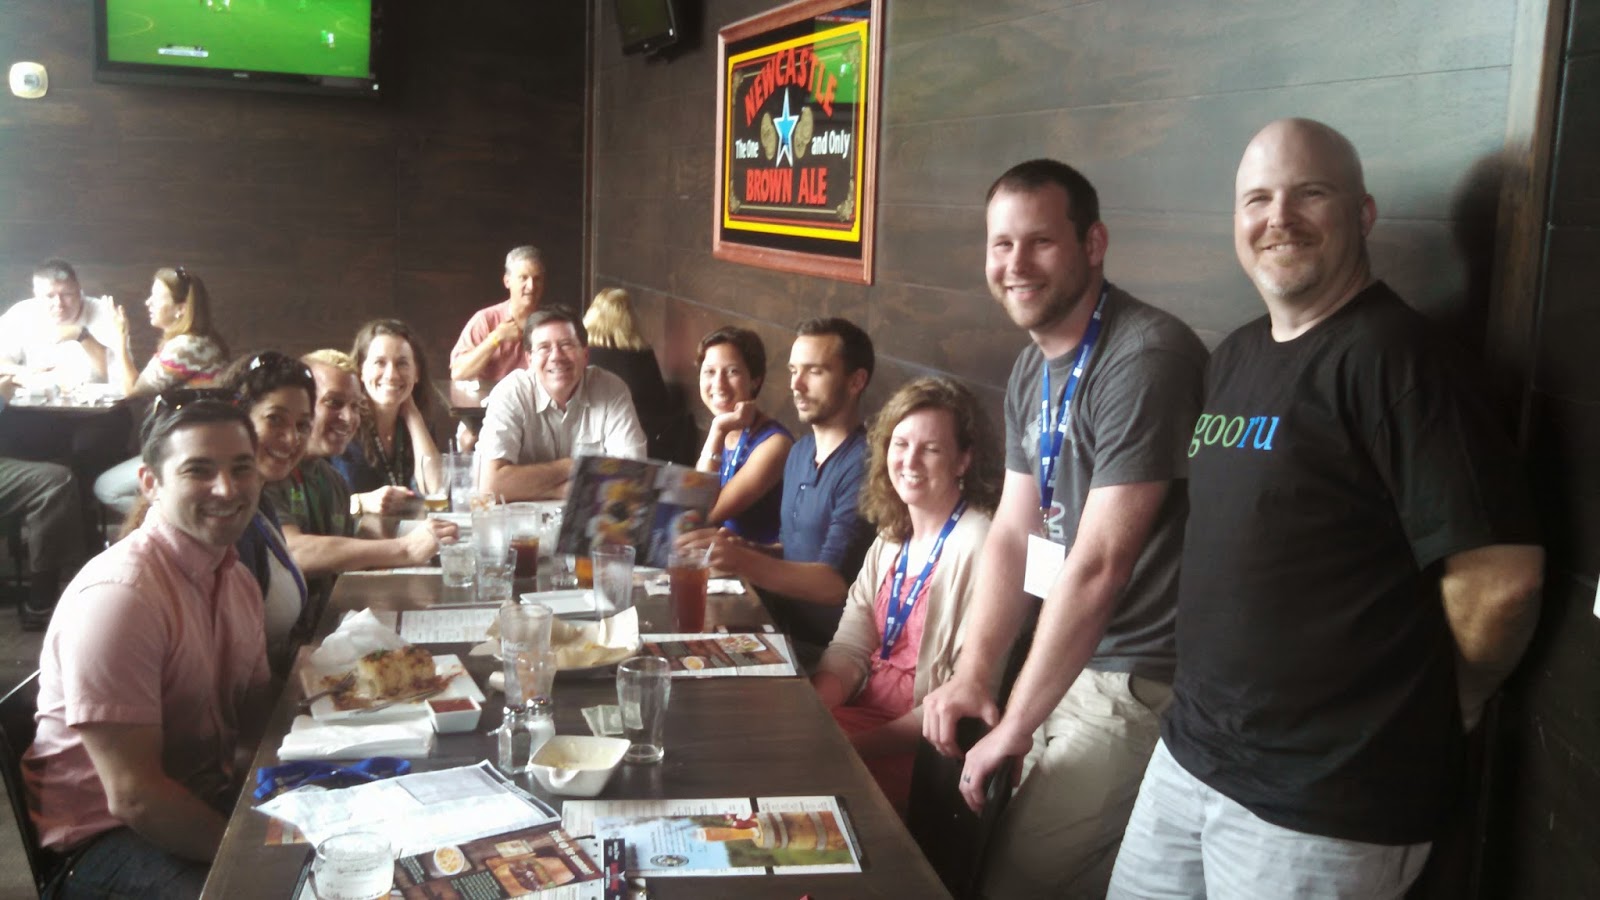
Future Google Certified Teachers meeting for the first time

I also met up with a few of the teachers who would be attending Google Teacher Academy with me at the end of July (see below).
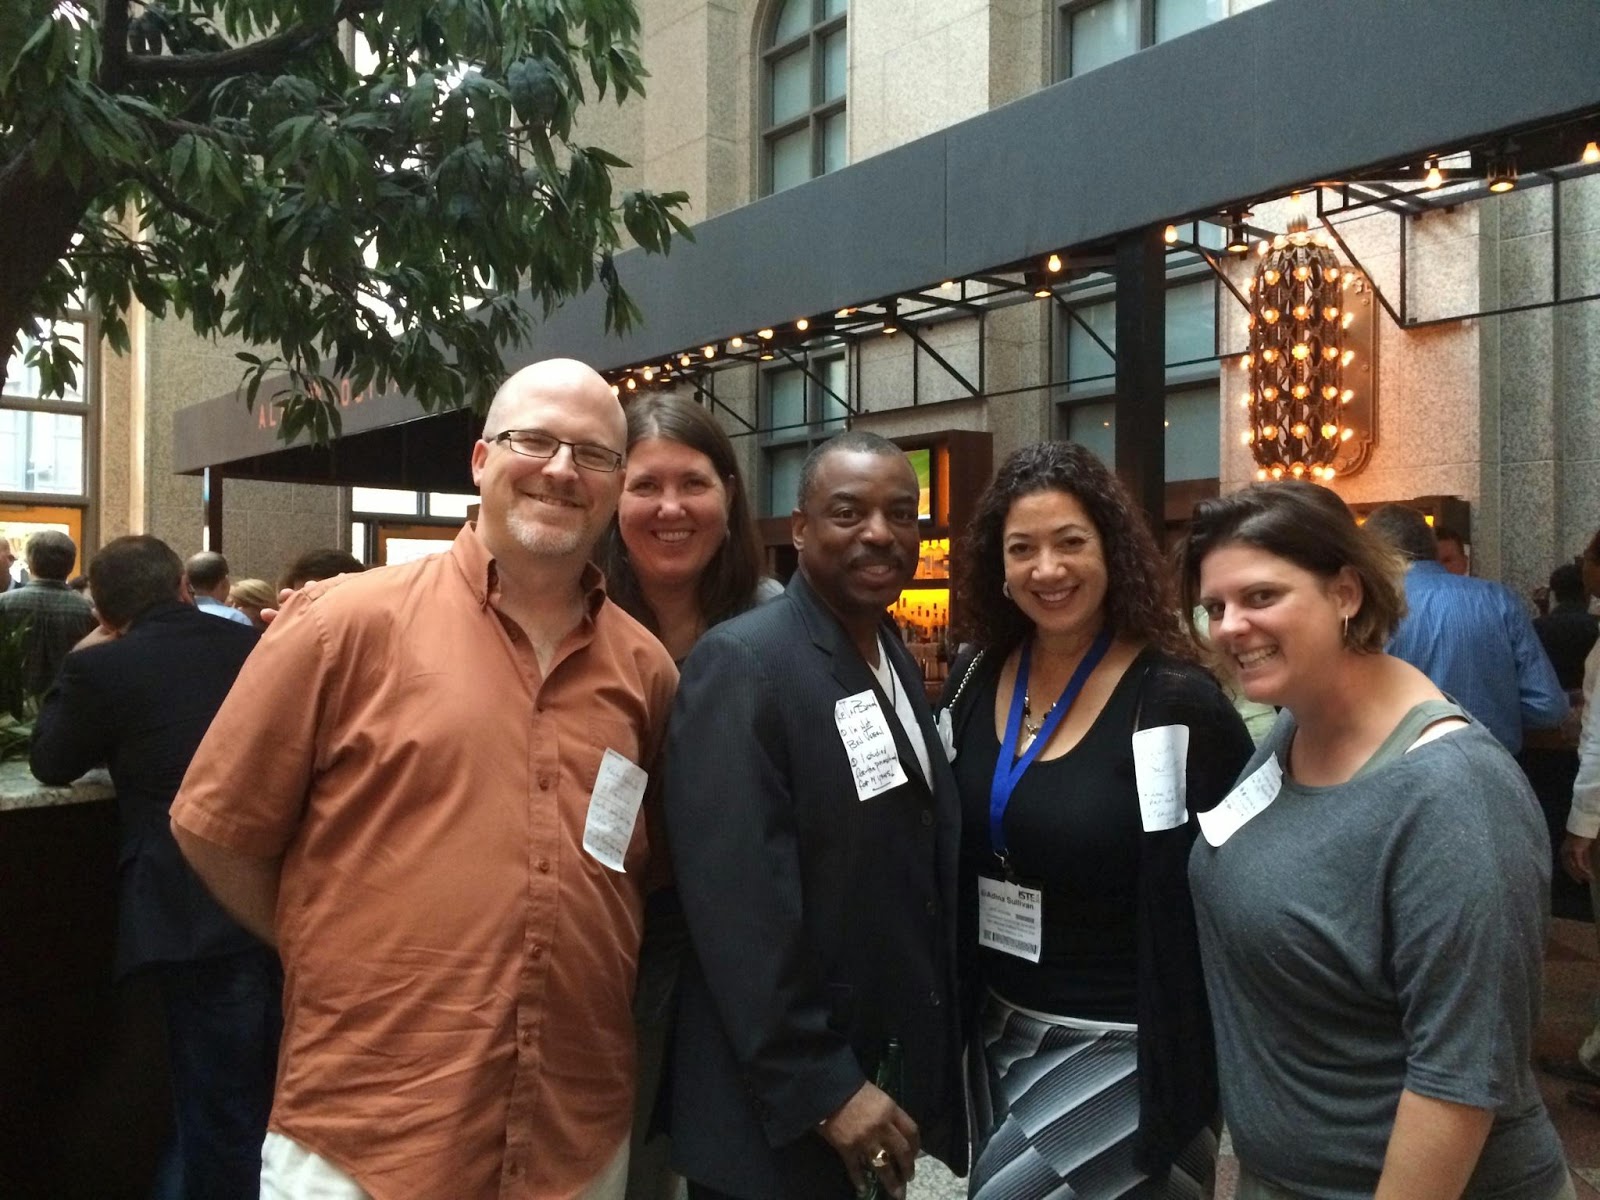
Oh right, I also got to meet Levar Burton, fresh off his
Reading Rainbow App kickstarter success.


Perhaps the most affecting part of the trip was my visit to the National Center for Civil and Human Rights. I had a free afternoon, so I visited this museum, most of which is dedicated to the Civil Rights movement in the early 1960's in the South, especially Atlanta. I found it an extremely emotional experience. I am a history buff and have a good understanding of the events of the 60's, but going through the well-designed exhibits brought home the personal costs to people of that era. I found myself furious that these things had happened in my country, and wondering to myself, "If I am so emotionally affected by this, what can it possibly be like for the black parents and children who are walking through here with me?" If you're ever in Atlanta, this museum is a must-see.

Mural at the National Center for Civil and Human Rights.
Mid-July - Vacation - Amsterdam, Netherlands
A long time ago, when I was a relatively new teacher, a veteran gave me some great advice. He said it was every teacher's responsibility to do something different during the summer, to become a more well-rounded person and therefore a better teacher. Professional growth is important, summer jobs are important, but a one-dimensional teacher is not doing his or her students any good.
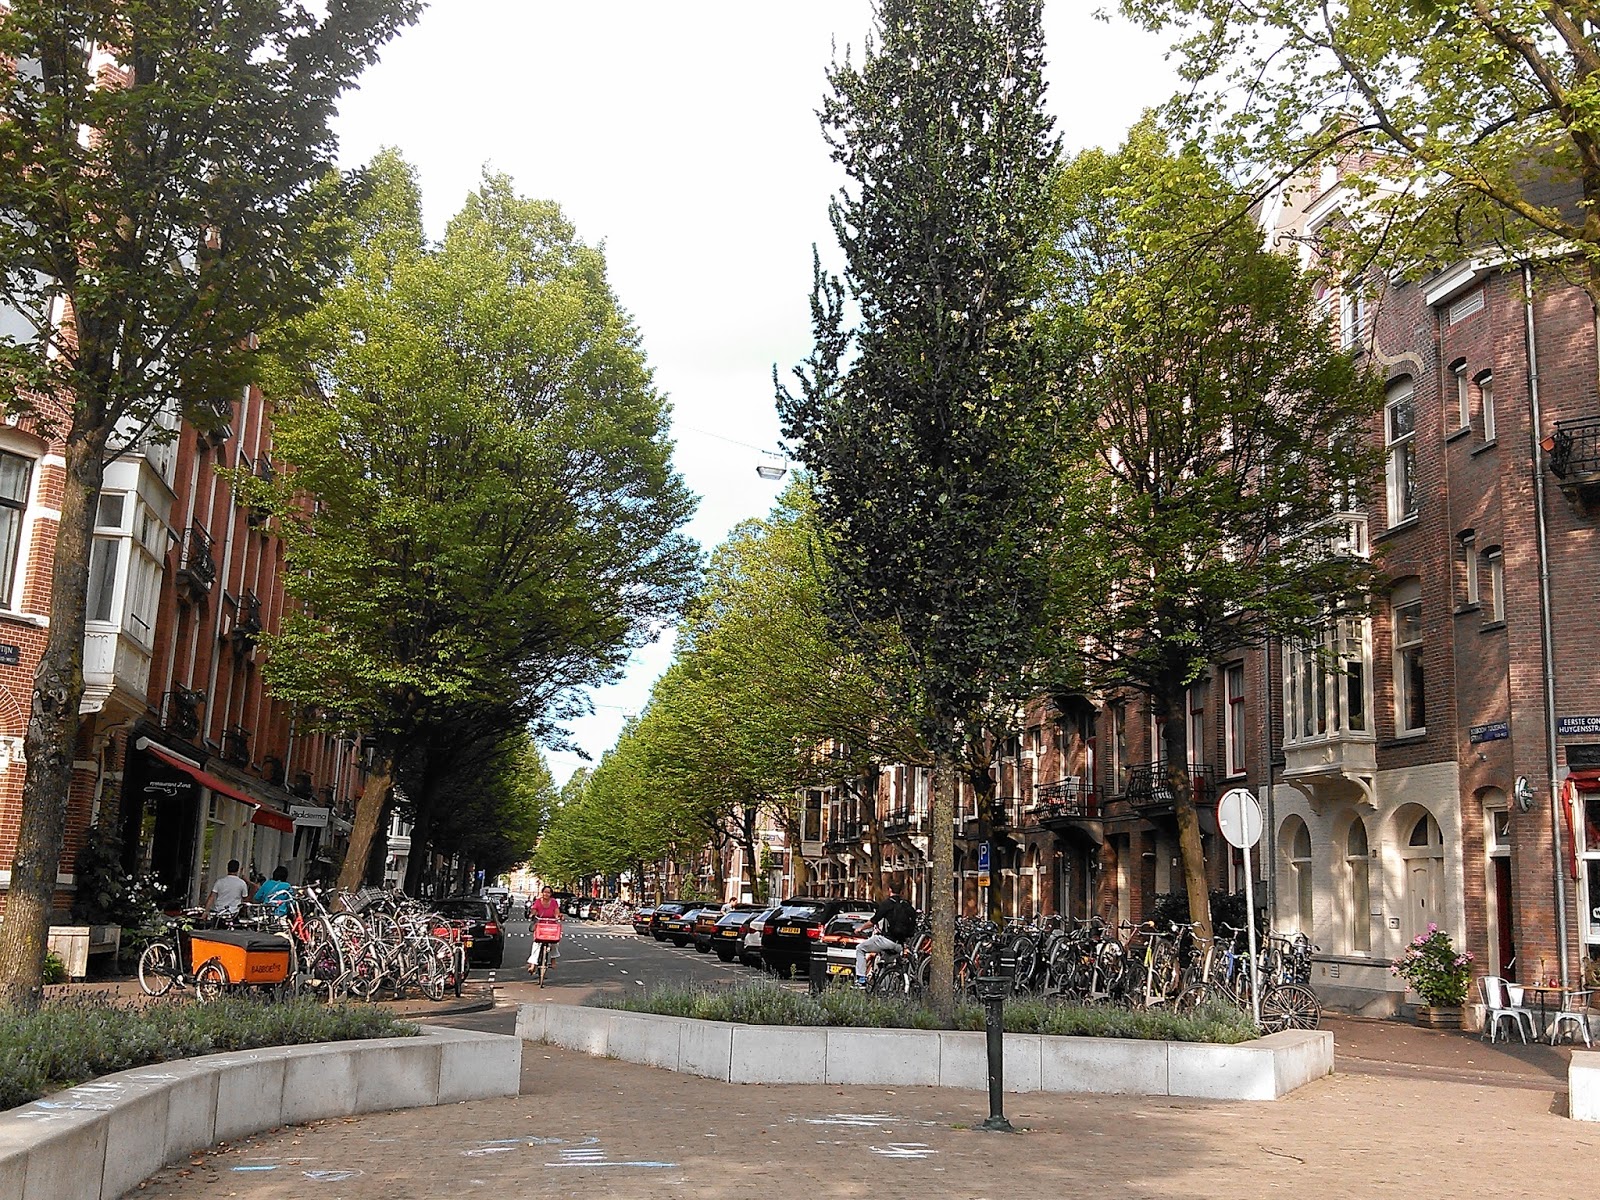
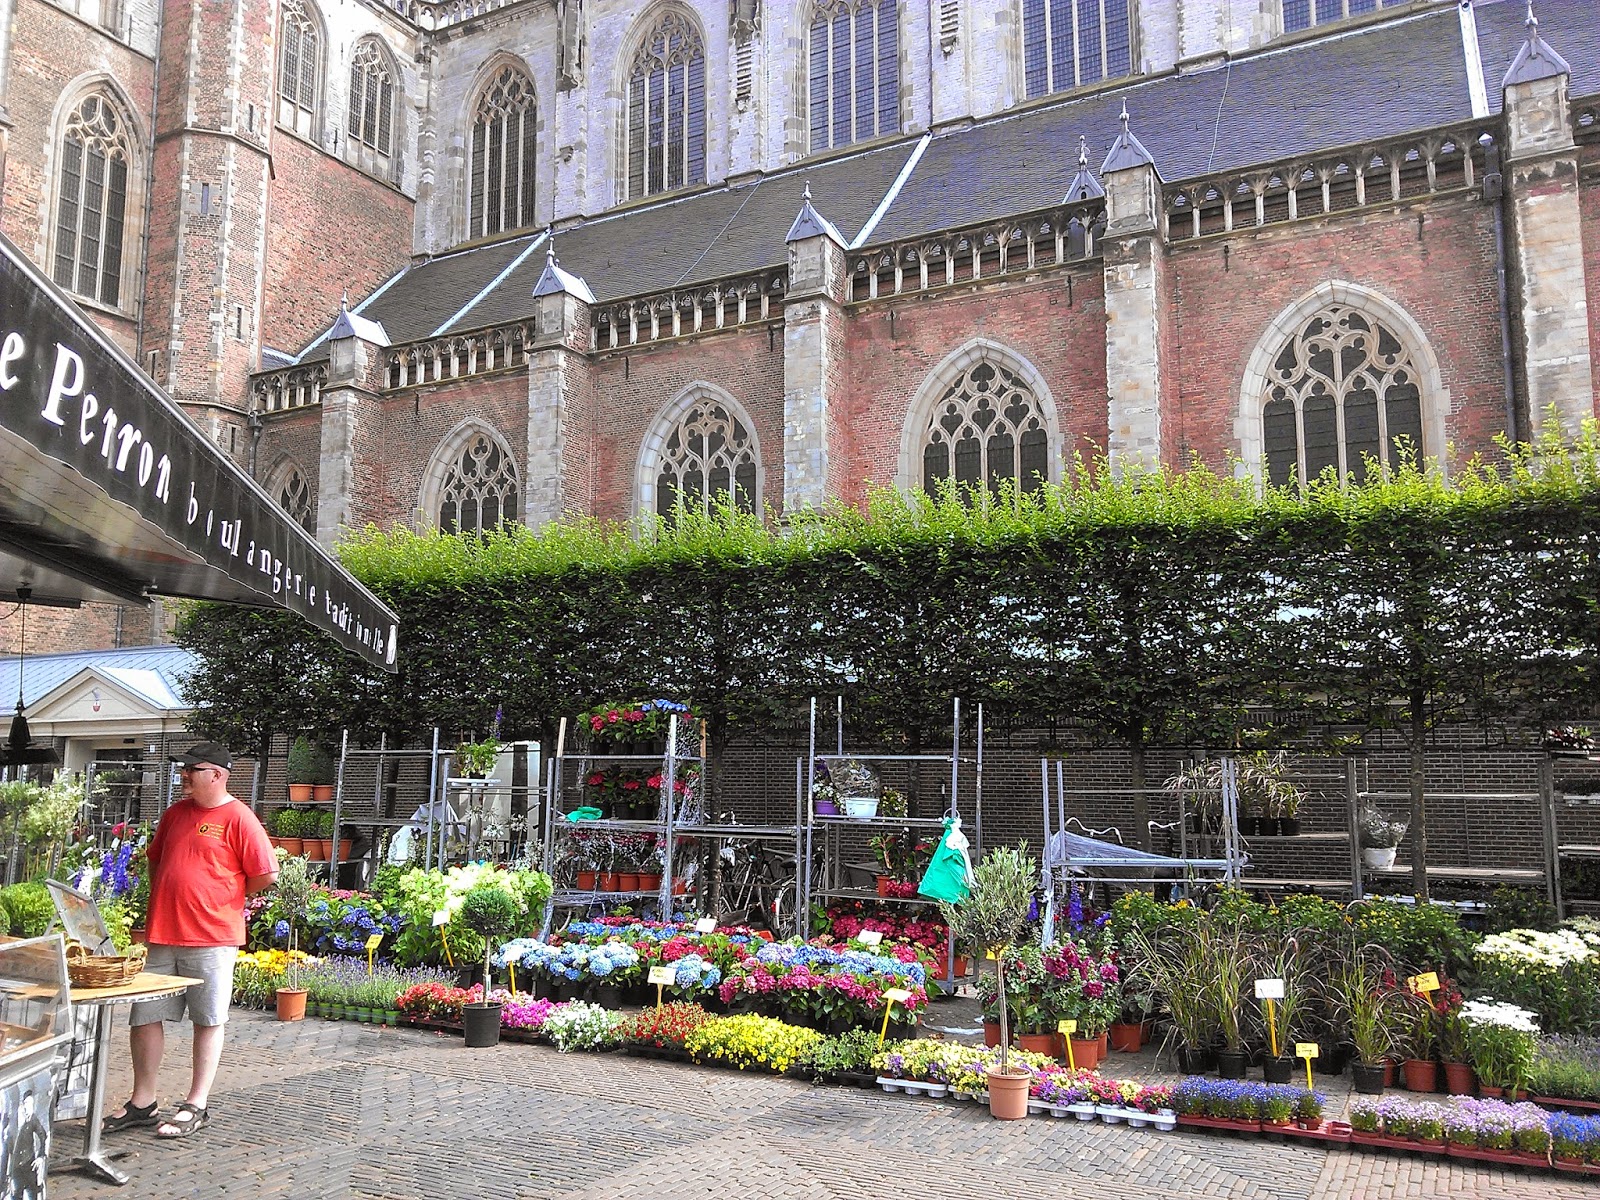
My wife and I enjoy travel, especially in Europe, and for the first time in a few years, we had the time and money this summer to take a European vacation. We chose Amsterdam, because it was one of the big cities we had never visited. While others may try to fit in many locations on a two-week trip, we like to stay local and get to know one or two areas well. We rented an apartment and stayed in Amsterdam except for a couple of quick day-trips to other nearby cities (Haarlem and Zaandam).

We got to experience the FIFA World Cup finals in one of the countries involved. Unfortunately, since the Netherlands' team had lost to Argentina in the semi-finals, they were only playing in the third-place game, which almost no one in Amsterdam cared about. There were a few isolated fireworks after the victory, but most of the city responded with a very clear "meh".

We were greeted with a strong thunderstorm the first night we were there. Since we live in California, we thought this was great fun! Not so much fun was trying to figure out how the windows closed at 3:00 am in an unfamiliar apartment. A few days later it got sunny and hot. The locals we talked to expressed how much they loved the sunny weather; we wished it would get cool and rain again!

Our friends who live in Berlin came to visit us in Amsterdam for a weekend. It was interesting to hear their perspective on how Amsterdam had changed over the years, and how it compared to many of their other favorite cities.

I have already written about our experience using Google+ for photos during our trip. Another conversation I've had with people is about email: "to check or not to check". Do you completely cut off during your vacation, and never look at emails or tweets or other electronic communication that might remind you of work? Or do you stay plugged in and try to keep up? It seems like everyone has their own rationalization for their preferred strategy; here's mine. We had wi-fi in our apartment, and brought our Chromebook along with us, so we could stay in contact with family and friends. I also used that to stay up with emails and other messages, because (a) I wanted to make sure I was aware if there were any true emergencies that popped up, and (b) I didn't want to be overwhelmed with hundreds of emails when I got back. I did NOT immediately respond, or spend as much time with email as I would have at home. But I did set aside an hour or so on two occasions to send quick replies, save emails that I would need later, and delete emails I didn't need. Some people argue that you need to completely disconnect in order to relax on vacation. For me, I was more relaxed knowing that I was keeping on top of my inbox.
End of July - Google Teacher Academy - Mountain View, California
The last of my travels for the summer was to the Googleplex in Mountain View, not too far from San Jose. Google's Education division partners with CUE to put on Google Teacher Academies (GTAs). These are two-day workshops in which teachers work with each other and with Google employees ("Googlers") on all kinds of education topics. The sessions are productive and fun, but they are only held a few times a year, in places all over the world, and are limited to 50-60 teachers at a time. This means they are highly competitive to get in; I had applied twice before and was not accepted before finally getting in to this GTA.
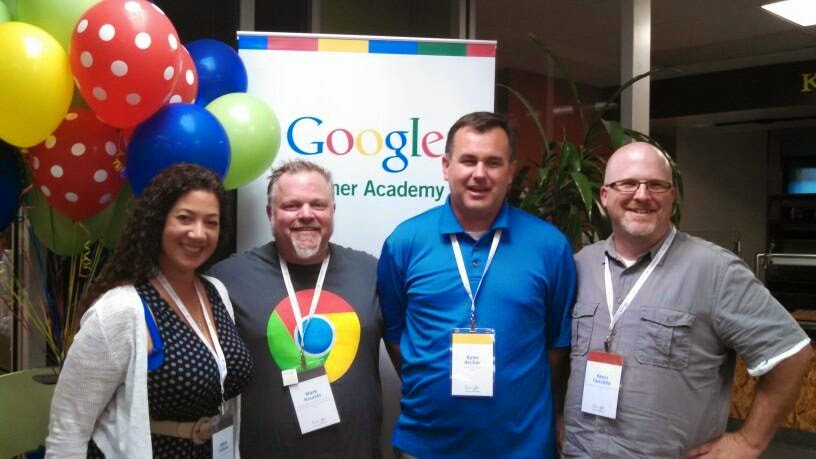
L to R: Adina Sullivan (San Marcos), Mark Rounds (San Diego
Unified), Ryan Archer (San Marcos), and yours truly
Even better, several colleagues and friends, including three from San Diego, also got accepted to this GTA. Despite my surprise that many of them were not already Google Certified Teachers (GCTs), it was great to know that I would already be familiar with a dozen or so participants, leaving fewer than 50 names and faces to learn! That became much easier, though, because the photons had barely left the acceptance emails before a G+ community had been established and online introductions were being passed around. Our group started working together as a team months before ever meeting in person.

In front of the Google Fairchild 1 building, on Fairchild Drive.
The content of the sessions was secondary to the relationships and networks that we built among the group. Still, I did come away with some thoughts about specific tools. I think Google Maps and Maps Engine may be the most under-appreciated app in education. I am pretty familiar with the basics of YouTube, but learned more about channels and settings, which will make it easier for me to share with teachers and students. Googlers told us about the development process, features, and plans for Classroom and for Play for Education, both of which seem to be game-changers for the use of hardware and software in education, in our district anyway. Last but not least, Google Art Project has expanded and is now known as Google Cultural Institute; it includes amazing resources about historical events and world wonders as well as art museums.

One of the requirements of GCTs is that we share what we have learned with other teachers. That's already my job in my district, and I'm signed up to present at three conferences this fall, at minimum, so no problems there. We also are required to put together an action plan that outlines a project we'd like to undertake. The seed for my particular project has been sitting in my brain for a while but started to germinate this summer. I'd like to develop a badge system for teachers' professional learning, taking some of the concepts of micro-credentials and some from gamification, to motivate and reward teachers' everyday accomplishments. I'm still developing the idea; I'm sure you'll read more about it in this blog in the coming months.


Thursday, August 7, 2014

SDUHSD Instructional Technology Vision Draft

Over the last six months, SDUHSD has been engaged in a process to develop a vision for how instructional technology should be implemented in our district. A team of 30 faculty, staff, and administrators developed the following draft, which is now being shared with parents, students, and community groups. The team tried to write a vision that was general enough to be broadly applicable and lasting, yet specific enough to be useful.

The statements below are not yet final and have not been adopted officially by our school board, but we hope that they will be soon. We welcome your comments, either on this blog post or by email to kevin.fairchild@sduhsd.net.


SDUHSD Vision for Educational Technology


The San Dieguito Union High School District uses instructional technology to provide a world-class education that engages students, inspires achievement and service to others, and prepares them to be lifelong learners and responsible members of society.

Strategic Themes

Student Outcomes

Through the use of technology, our students develop the ability to think creatively and critically, evaluate tools and information sources, communicate effectively, and collaborate productively in order to connect with the world and prepare for college and careers.

Instruction

We provide dynamic, engaging, and rigorous learning experiences for all students through the purposeful use of instructional technology as part of our innovative, standards-based curriculum. Teachers continually evaluate the effectiveness of instructional technology through student outcomes.

Citizenship and Safety

We teach and model the importance of online safety and civility, personal responsibility for one’s own digital presence, and shared responsibility of digital citizenship in a global community.

Equity

We ensure relevant, appropriate, and equitable access to technology for all in order to support student success.

Support

We provide ongoing professional development, technical support, and dedicated resources that foster dynamic learning experiences through innovative applications of instructional technology.


Friday, July 25, 2014

Updates on Four Web Tools

Many of the web tools that SDUHSD teachers use have been updated and improved over the summer. Here are some changes for four of those tools: Padlet, Remind101, Today's Meet, and Socrative.


Padlet

  • You'll see a new "Dashboard" that lists Padlet walls you have contributed to or created.
  • You can install a Chrome Extension that lets you add links directly to a wall.
  • There is now a third layout option (Grid), in addition to Freeform and Stream.
  • You can now set up "moderation" on a wall, so you (or someone else) must approve posts before they appear on your wall.
  • How do I embed a Wall on a Google Site?


TodaysMeet


You can still just quickly and easily create a room without signing in, just as you could before. Now, however, if you create a (free) account, you can take advantage of a number of extra features, including:
  • Moderating content
  • More control over how long a room lasts and when it closes
  • Limiting who can join your room


Remind (formerly Remind101)


  • The most obvious change is in the name; apparently they don't need the "101" anymore. This program that lets you safely and securely communicate with students and parents from your phone is a great way to connect with your classes.
  • The other addition is native apps for iOS and Android for use by students and parents. This makes it just a bit easier for them to get their messages all in one place.


Socrative


As of July 12, all Socrative accounts have been updated to version 2.0. (Some of you may have been using this version since October; now it's no longer a choice.) The look and feel of the website has changed, but the basic functions are still the same. The new version also includes:

  • Student Navigation within Quizzes
  • Google Drive Integrations
  • Common Core Tagging
  • Individual Student Reports
  • Printable Quizzes
  • Real-Time Results View


Using Google+ for Vacation Photos

During our recent trip to Amsterdam, my wife and I used Google+ to share photos with family and friends. This was the first time I had tried to use the Photos capability of G+ on the fly, rather than as a bulk upload after an event. There were some parts of the system I loved, others that took some getting used to, and some that just seem terribly designed and still leave me scratching my head. Here are some of my thoughts based on our recent experience.

The Good - Things we loved!

  • Automatic upload from the phone - We set up "Auto Backup" on the first day of the trip and never looked back. Since my wife did 99% of the photography, we set up her phone to automatically upload photos to her G+ account whenever we had wi-fi (which was often, including in our apartment). I was impressed with how quickly and unobtrusively the photos were backed up, and then Julie got a G+ notification whenever it happened. On previous trips, we would have to remember to upload pictures every few days, if at all. I really appreciated this feature when we left her phone in a bar one night. They found it and held it for us, and we got it back a few hours later, but during that time, we had no worries about losing all of our pictures, because we knew they were saved to G+.
  • Sharing an album with those outside G+ - It was easy for our friends and family who do not have G+ accounts to view our pictures. I wasn't sure about this at first; I thought Google might require them to create a G+ account just to see what we shared, but that was not the case. We set up an album that we shared publicly, then just got the link to that album and we could share that however we liked. I sent the link by email to a couple people; I shared it on Facebook, and on Twitter. The link remained pointed to the album even as we added pictures, so our friends and family had just one link to always see our most recent uploads. 
  • Caption and slideshow capabilities - Adding captions to pictures was easy and quick. Our viewers could choose to see a single picture with caption, or view a slideshow of all our pictures. Display options, even for those outside G+, are pretty great.
  • Photo editing capabilities - On the few occasions we need to rotate or crop or slightly edit a picture, we could do it directly from within G+. Nice features, though we didn't use them too often.
The Bad - Things we didn't like but could work around
  • Automatic "filters" and "enhancements" - In the first couple of days, G+ kept randomly "improving" our pictures, with filters and borders and such. If I wanted that, I'd do it myself. We figured out how to turn that feature off: go to "Settings" and scroll down a bit. You'll find checkboxes for "Auto-enhance" and "Auto-awesome". It's not that I don't want those capabilities; I just want to choose when to use them, not have G+ choose them for me.
  • Showing only highlights - It took us a while to get used to the "Highlights" view of photos, and to figure out why we weren't seeing all of our pictures. We learned that we could control the "Highlights" by marking some pictures as highlights and removing others, but overall it seemed pretty useless. Unless you could use the "Highlights" feature with other people (for example, so your family only sees the best pictures instead of every single one), which we could not find a way to do, "Highlights" seems like just another layer to get in the way of seeing our pictures.
  • Adding photos to an album - This seemed more difficult than it needed to be. Here's how we managed to work through it. (1) Photos were auto-uploaded; (2) We had to open our "Amsterdam" album and choose "Add Photos"; (3) We had to scroll through all our photos and select the ones (from memory) that had just been uploaded; (4) Click on "Add Photos". It would have been much easier to simply open the auto-uploaded photos and choose to add them to an album directly from that page. If that capability exists, we couldn't find it.
  • Sharing multiple photos without creating an album - To share only some of our photos, not all of them, we had to create a second album. That meant that after we added our photos to our "Amsterdam" album, we then had to go to our "Amsterdam Shared" album, and go through the entire process of adding photos again. On the one hand, once we did that, access by other people was easy (see "The Good", above.) On the other hand, we really wanted a way to just share some photos in an album, maybe with "highlights" or "stars" or something, and we just didn't find it.


The Ugly - Ugh. Really?
  • Handling multiple accounts - The way G+ handles multiple accounts is terrible. Let's just set aside that I have to have separate G+ accounts for each email address I have and can't merge them. There were two of us on this trip; we've been married for more than 20 years and have shared everything, but we can't share photos in G+ so we can both work on them? In order for me to add photos to an album, edit them, or write captions, I had to log in to Julie's G+ account, even though she had shared the photo albums with my own account. This really needs to work more like Google Docs, where one account can share photos with another and decide the level of access: edit, view, or comment. Right now, that doesn't exist. 
  • Finding albums shared with me - Once her "Amsterdam" photo album had been shared with my account, I expected to see it in my "Photos" section. Wrong. In order to even view those pictures with my account, I had to search and find the post in my stream that announced that she had shared it. At first that wasn't so bad. After a few days, and hundreds of other posts in my stream, it was a major pain. Surely there is a better way to access an album that has been shared with me? Anyone? Bueller?
  • Integration with other Google Apps - Trying to insert a picture from G+ into Gmail, or a Google document, or a Blogger post (like this one) is, again, much harder than it needs to be, considering that all these tools come from Google. This may have to do with the multiple-account issue, or it may just be that development on different tools occurs at different speeds. More than once, though, I found that the best (and sometimes only) way to insert a G+ photo into some other web tool was to download the photo and then re-upload it. (That's so 2006.) Seems like a waste for photos that are already in the cloud. (By the way, does Picasa Web Albums even exist anymore? Is that still a thing? Is it separate from G+ Photos? I can't even tell.)
We loved our trip, and on balance, G+ Photos was a great way to share. As with anything, though, there's room for improvement!


Saturday, June 28, 2014

My ISTE 2014 "Think topics"

One of the things I do at conferences is take time to step back and think about big picture items that are difficult to get my head around in the flow of everyday life. So at ISTE this year, in addition to the sessions, and conversations with member of my PLN, and workshops, and keynotes, and wandering the massive exhibit hall, I'm setting aside some time to try to do some planning for the next school year.

Among my topics are the following:

  • Instructional Coaching: How can I and the other ToSAs be effective at working with teachers in classrooms this year, instead of in pull-out workshops?
  • Google Drive workflow: We have several new tools, and Google has added and changed features. What are some best practices for teachers to use Google Drive with their students?
  • Getting tablets into teachers' hands: This year we had nearly a dozen Android tablets out for teachers to work with. Next year I'm hoping we can purchase several dozen more. What are some ways that teachers can use these effectively in their classrooms?
  • Next steps for Instructional Technology Vision: Our Tech Vision Team did a great job this year setting out our district's overall vision for instructional technology. Now, what are our next steps in turning that vision into practice?
  • Inspect Itembank rollout: What is the best way for us to introduce and support our new Common-Core-aligned itembank, so that teachers can make use of it?

Rubric Scoring and Grading Scales

If you use a rubric to evaluate student work, how do you convert that rubric score to a percentage grade? A recent conversation on Twitter turned to these considerations, which at first may seem trivial, but are actually quite significant when communicating performance levels to students. 

In the conversation, one person referenced roobrix.com, which is a website that claims to calculate “correct” grading based on rubrics, as opposed to most teachers’ practice, which results in “wrong” grades. The site itself is useful, if limited. As I read the rationale behind the “correct” rubric grading, something seemed off to me, but I couldn't put my finger on it for a while. I thought about my own grading of student work using rubrics until I realized my discomfort.

First, you should read the explanation given at roobrix.com. Then come back; I’ll wait.
.
.
.

I’d like to highlight what I think are the two problematic quotes from that page:

“Let's take a rubric with four levels and four criteria as an example. If a student's performance is at the bottom level (Level 1), that means the student has met basic expectations in a limited or unsatisfactory way. This effort should be considered a minimum passing grade.” 

“Forgetting that the lowest performance level represents a minimum pass, [teachers] are wrongly equating this bottom level with complete failure.”

If your rubric is such that the lowest performance level represents a minimum pass, then the reasoning and calculation at roobrix.com is rock-solid. I have no quibble with that.

However, if the lowest performance level in your rubric represents a minimum pass, how do you communicate to students when they have performed unsatisfactorily? Is there truly no room in your grading scale for “not good enough?” We all know that not all students master tasks or skills sufficiently on the first go-around. If a rubric is to communicate to students their level of mastery, a rubric that only goes down to “minimum pass”, does not communicate to students who have not performed up to mastery.

Here’s what I did in my class. I taught high school science, and used the following 3-level rubric for lab reports.


1
2
3
Data
  • Data was collected and recorded poorly or incorrectly.
  • Too few data points were recorded to effectively analyze the data and graph.
  • A data table, if present in the lab report, is unreadable or unlabeled.
  • No justification is given for data points that were discarded.

  • Data was collected and recorded correctly.
  • Enough data points were recorded to effectively analyze the data and graph.
  • A data table, including units, is displayed in the lab report.
  • A justification is given for any data points that were discarded.

  • Data was collected and recorded correctly.
  • Enough data points were recorded to effectively analyze the data and graph.
  • A data table, including units, is displayed neatly and legibly in the lab report.
  • A justification based on physical circumstances is given for any data points that were discarded.

Graphs
  • Graphs have incorrect or unrelated quantities.
  • Graphs are sketched quickly or are unreadable.
  • Graphs are drawn with inconsistent scales.
  • Graphs do not include a best-fit line, or data points are connected dot-to-dot.

  • Graphs are drawn readably.
  • Graphs have correct quantities, perhaps on opposite axes.
  • The scale of each axis is not explicitly labeled but is consistent and evident.
  • All straight-line graphs include a best-fit line.

  • Graphs are drawn readably.
  • Graphs have correct quantities on correct axes.
  • The scale of each axis is clearly labeled.
  • All straight-line graphs include a best-fit line. Curved graphs do not.

Analysis
  • The best-fit curve is missing or does not fit the recorded data.
  • The best-fit equation is missing or left as a mathematical function (y=mx+b) with no physical substitutions.
  • Unit analysis is missing or incorrect.
  • Slope and y-intercept are left as mathematical numbers with no physical meaning attached.

  • The best-fit line does not fit the data appropriately.
  • Physical quantities are substituted for x and y variables but not the slope or y-intercept in the best-fit equation.
  • Unit analysis is missing or incorrect.
  • Slope and y-intercept are left as mathematical numbers with no physical meaning attached.

  • The best-fit line is appropriate for the data, both mathematically and physically.
  • Physical quantities are substituted for x and y variables, slope, and y-
  • intercept in the best-fit equation.
  • Units are analyzed for the slope and y-intercept.
  • A physical meaning is assigned for the slope and y-intercept.

Conclusion
  • The outcome of the experiment is not explained.

  • The outcome of the experiment is expressed as an equation or formula.

  • The desired outcome of the experiment is expressed in terms of a relationship between physical quantities.


These can be summarized as follows:
  • 3 - Perfect or nearly so
  • 2 - Well done, but….
  • 1 - Unsatisfactory

Once I had evaluated those criteria, I combined them into a holistic, overall 1/2/3 score. (As I’ll write below, I would re-think the holistic scoring today. For now, let’s consider an additive score for all the rubric criteria.)

When I developed the 3-level rubric, I quickly realized that it was incompatible with a traditional 90/80/70 grading scale. Students who consistently perform at the next-to-highest level (2) would score a 66% for the class, which on a traditional grading scale would be a D. That’s not reflective of their true ability. Fortunately, I had the freedom at my school to modify my grading scale. So I re-wrote my percentage scale to reflect the scores in my rubric:
A - 83% to 100%
B - 66% to 82.9%
C - 50% to 65.9%
F - below 50%

What that meant for students:
  • A student who was consistently scoring 2’s would get a 66%, just barely a B
  • A student who scored mostly 2’s but some 1’s would be below 66%, for a C
  • A student who scored mostly 2’s but some 3’s would be above 66%, for a solid B
  • A student who scored mostly 3’s would be above 83%, for an A
  • A student who scored mostly 1’s would be below 50%, for an F

A rubric score of 1 was intended to communicate to the student that their performance on that particular criteria was unsatisfactory and needed to improve. It was not intended to be a “minimum passing level”. If your rubric does not have a level for “unsatisfactory” work, then your only choice when a student submits something like that is to give it a zero (off the rubric), which will seriously imbalance grades.

Everything in my class was graded on the same 1/2/3 scale: homework, labs, quiz and test answers, projects, everything. This maintained the integrity of the scoring system and made it easy for me to communicate with students and parents.

As I mentioned above, when I go back into the classroom, I have a couple of changes I would make to this system. First, I would eliminate my holistic overall grade. I think it left too much room for my (sometimes inconsistent) interpretation and was not specific enough feedback for students. Instead, I would use an additive method, and score students out of 12 points for each lab report (4 criteria x 3 possible points for each criteria). Second, I would require students to re-do work for any 1’s they scored. Too often my students settled for 1’s simply because they didn't want to go back to old assignments, and frankly, I didn't push it because I didn't want more papers to grade. Today, I would find a solution for that, because I think I better understand the importance of students moving toward mastery, no matter how long it takes.

I think the take-away message here is that your rubric and grading scale have to be designed to work together. If you are in a situation in which you can modify your grading scale to fit your rubric, you're in good shape. If your school or district requires you to use one particular grading scale, design your rubric to fit the grading scale. In either case, the primary consideration should be communicating expected and actual performance levels to students, even if that performance level is "unsatisfactory".